Look around.
If a group of pioneering physicists led by Heinz von Foerster were right when they published a jaw-dropping paper in the journal Science back in 1960, today is the day.
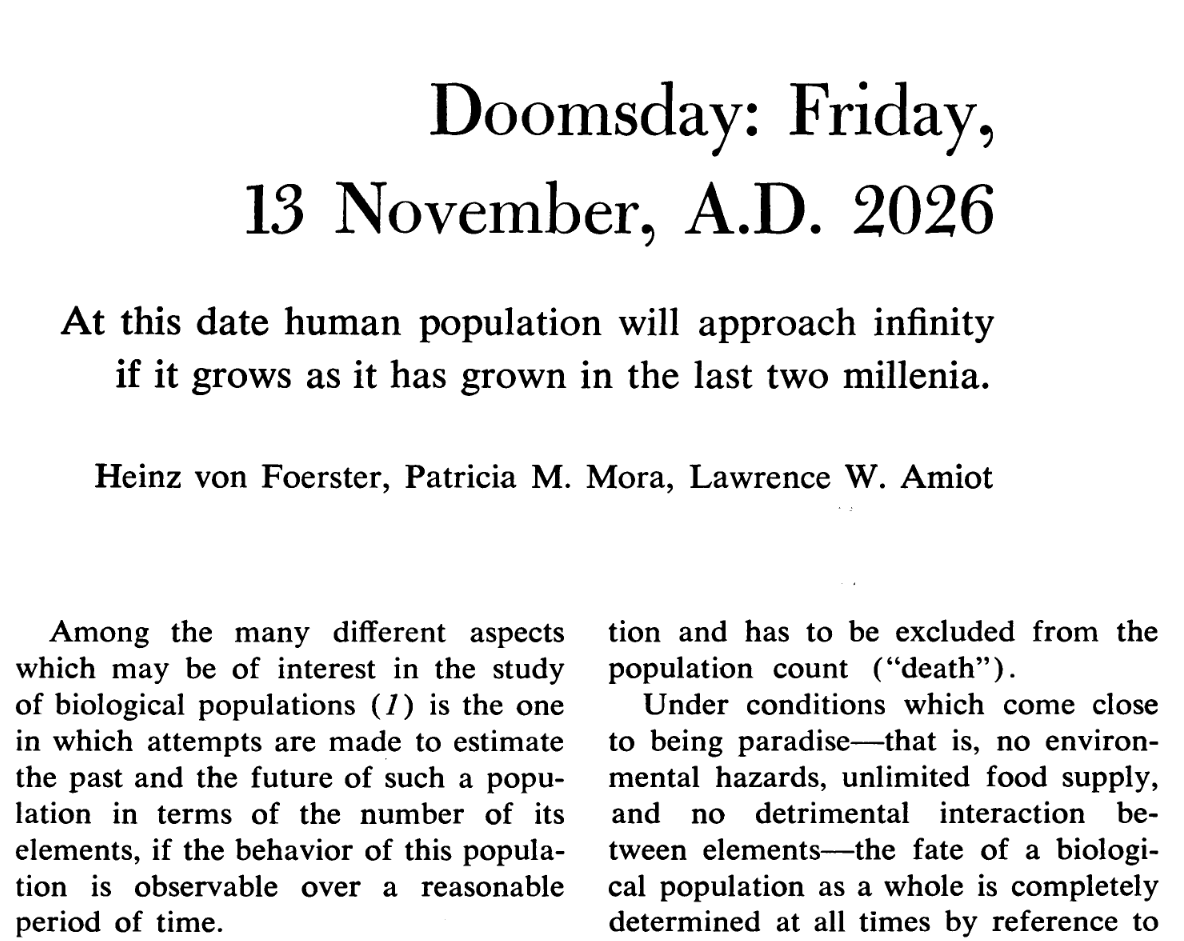
Titled "Doomsday: Friday, 13 November, A.D. 2026," their paper calculated that on this exact calendar date, the global human population would reach infinity. Humanity wouldn’t go out in a fiery nuclear apocalypse or a cataclysmic asteroid impact; instead, von Foerster cheekily predicted we would simply be “squeezed to death” as a hyper-accelerating population hit a mathematical brick wall of infinite density.
Well, November 13, 2026 is finally here. We aren’t being squeezed out of existence, and grocery stores are still standing. So, how did a team of brilliant scientists end up with an equation that predicted a population singularity for today? More importantly, where did the math go wrong?
Let’s take a deep dive into the math, the satire, and the real-world demographics that saved us from hyperbolic collapse.
1. The Core Premise: Interaction Density
Standard population growth models assume growth scales linearly with population size—the more people there are, the more babies are born. But von Foerster argued this baseline missed a crucial human trait: cooperation and technological innovation.
Human progress accelerates because people interact, share ideas, and invent better ways to survive. As the population grows, the network of human interactions expands even faster. More interaction leads to better technology, higher living standards, and accelerated growth rates.
Von Foerster expressed this using a non-linear differential equation:
Where:
is the total global population size, is time, is a scaling constant, is an exponent fitted empirically from historical data.
When von Foerster and his team fitted this equation against two millennia of population data up to 1958, they discovered something startling:
Because
The Rumor Analogy: Think of a room full of people spreading a rumor. The rate of spread doesn’t depend merely on the number of people, but on the number of pairwise interactions between them. Interaction capacity scales with the square of the population (
). Von Foerster modeled human population acceleration using a similar positive feedback loop.
2. Solving the Differential Equation: The Doomsday Asymptote
To understand how this leads to a specific doomsday date, we integrate the differential equation:
Integrating both sides yields:
Rearranging this equation to solve for
Where:
is a constant derived from historical baseline data, is a critical point in time where the denominator vanishes.
When
Why the Equation Blows Up
Look closely at the denominator:
As the current calendar year
When
When fitting their historical data to determine
3. Why the Math Failed: Reality Hits Back
Von Foerster’s paper was largely a brilliant, satirical critique of unchecked demographic extrapolation. It demonstrated that assuming endless positive feedback in physical systems leads to absurdity.
Two major real-world mechanisms broke the hyperbolic model almost immediately after it was published.
A. Carrying Capacity (
In ecological systems, biological populations do not grow unchecked; they are bounded by their environment’s carrying capacity (
- Hyperbolic Model: Driven by positive feedback (
- Logistic Model: Driven by negative feedback. As
approaches , the multiplier
While agricultural breakthroughs like the Green Revolution continuously raised Earth’s carrying capacity (
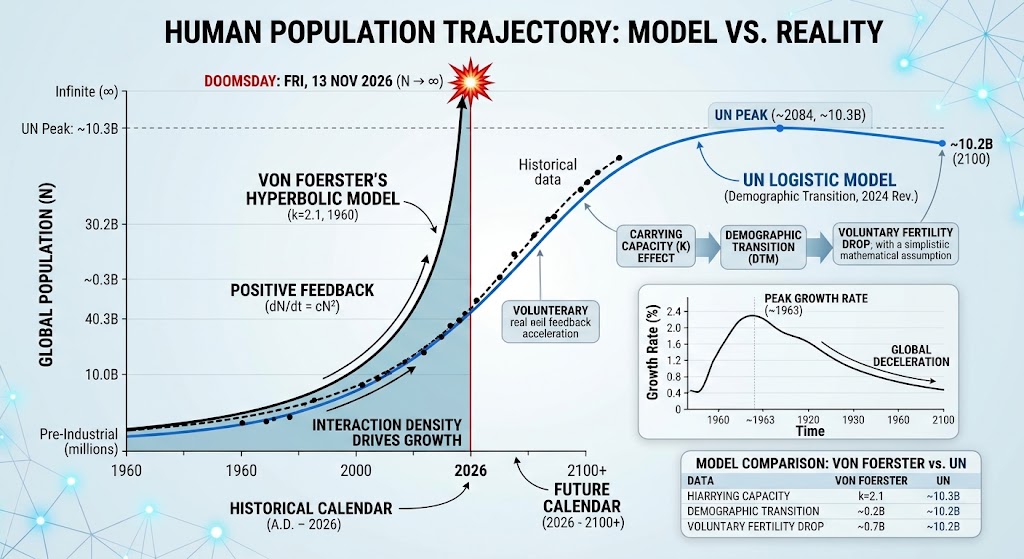
B. The Demographic Transition Model (DTM)
The primary reason von Foerster’s curve shattered was not a sudden lack of food, but a fundamental shift in human behavior: the Demographic Transition.
Von Foerster published his paper at the tail end of Stage 2 of global industrialization - a phase characterized by plummeting mortality rates alongside high birth rates. He mistook a temporary historical acceleration for a permanent law of nature.
Irony struck almost immediately:
- The 1962–1963 Peak: Just two years after the paper was published, the global annual population growth rate peaked at ~2.2% per year.
- Deceleration: Since the late 1960s, the global growth rate has continuously fallen. Today, it stands below 1.0%.
As societies industrialize, urbanize, and expand access to female education and economic opportunities, total fertility rates (TFR) fall dramatically. Higher density and economic development cause families to voluntarily choose smaller family sizes—the exact opposite of von Foerster’s assumption that density accelerates birth rates.
4. Von Foerster vs. Modern UN Projections
Today, demographic modeling has evolved from naive curve-fitting into complex cohort-component analysis tracking regional fertility, mortality, and migration rates.
Comparing von Foerster’s model to the United Nations World Population Prospects (2024 Revision) highlights the contrast between unbounded extrapolation and dynamic modeling:
| Feature / Metric | Von Foerster et al. (1960) | Modern UN Projections (2024) |
|---|---|---|
| Model Type | Power-law differential curve fitting | Component-cohort survival dynamics |
| Primary Driver | Unbounded positive feedback ( |
Negative feedback via socio-economic shifts |
| Global TFR Trajectory | Assumed effectively infinite acceleration | Dropped from |
| Peak Behavior | Infinite vertical asymptote ( |
Smooth plateau followed by gradual decline |
| Peak Date | November 13, 2026 | ~2084 |
| Peak Population | Unbounded ( |
~10.3 Billion |
Conclusion: The Ultimate Paradox
Heinz von Foerster’s 1960 paper remains one of the most brilliant pieces of mathematical satire ever published in serious scientific literature. By taking historical population trends to their logical mathematical extreme, he delivered a timeless warning: no dynamic trend can continue unchecked forever.
We survived November 13, 2026 without getting squeezed to death. Instead, humanity reacted to its own growth through voluntary behavioral changes, economic shifts, and declining fertility rates - turning a hyperbolic path to doomsday into a stable, manageable plateau.