Sometimes it is necessary to make an image of the mixture 2D data using different PGB pallets for every component.
For example, let create three 2D functions:
for (ix=1:100),
    for (iy=1:100),
        z(ix,iy)= exp(-(ix-30).^2./500).*exp(-(iy-30).^2./500);
        z1(ix,iy)=exp(-(ix-50).^2./300).*exp(-(iy-50).^2./900);
        z2(ix,iy)=exp(-(ix-80).^2./350).*exp(-(iy-80).^2./50);
    end;
end;
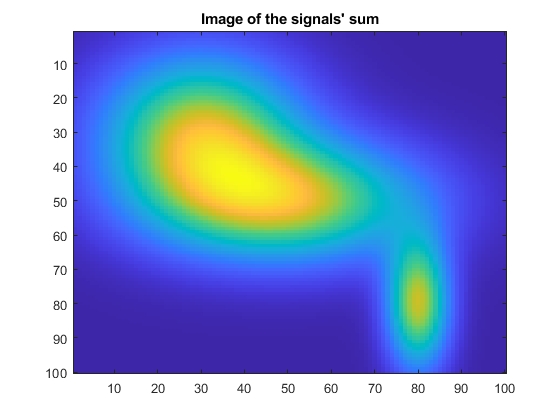
We can easily make an image of the resulting mixture of these function:
figure;imagesc(z+z1+z2)
title('Image of the signals'' sum')
As result we will have the image of the mixture as a sum of all functions:

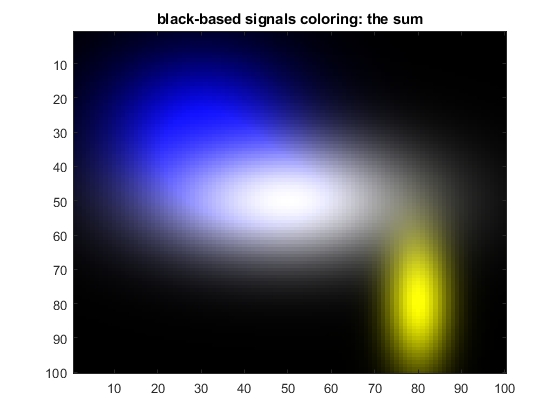
We can see the total behaviour of the functions sum but not every component. To keep that information is possible using by changing colour palettes for every component of the mixture. For example, we can use the blue pallete for the signal z, the grey palette for the signal z1, and yellow - - for the signal z2. For these we have to do following:
q(:,:,1)=zeros(100,100);q(:,:,2)=zeros(100,100);
q(:,:,3)=z;

q1(:,:,1)=z1;q1(:,:,2)=z1;q1(:,:,3)=z1;

q12(:,:,1)=z2;
q12(:,:,2)=z2;
q12(:,:,3)=zeros(100,100);

figure;imagesc(q+q1+q12)
title('black-based signals colouring: the sum')
The result will look as follow:

Now we can see not only 2D variability of the mixture of functions, but clear recognize the values of every component. What still can be improved is to apply the negative grey palette, when the minimum is represented as white and maximum - as the black colour. Such inverted palette is much more suitable for printing and for insertion in publications.
It can be done using following codes:
z21=(max(max(z))-z)./max(max(max(z))-z);
q21(:,:,1)=z21;q21(:,:,2)=z21;q21(:,:,3)=z21;

z22=(max(max(z1))-z1)./max(max(max(z1))-z1);
q22(:,:,1)=ones(100,100);q22(:,:,2)=z22;q22(:,:,3)=z22;

z23=(max(max(z2))-z2)./max(max(max(z2))-z2);
q23(:,:,1)=z23; q23(:,:,2)=z23; q23(:,:,3)=ones(100,100);

Q=(q21+q22+q23);
Q=Q./max(max(Q));

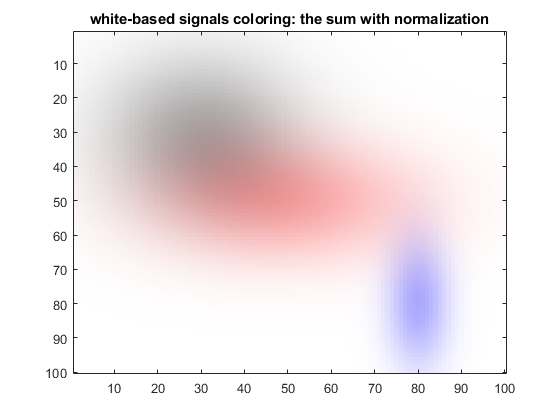
figure;imagesc(Q)
title('white-based signals colouring: the sum with normalization')
To extend every component visualization to the full scale of specific palette, we did the normalization of every function. As soon as the sum of functions cam be greater than 1 within the RGB components of the colours representation, the final sum Q was also normalized using its maximum value (in general, the minimum value also has to be taken into account for such normalization).
The resulting image looks as follow:

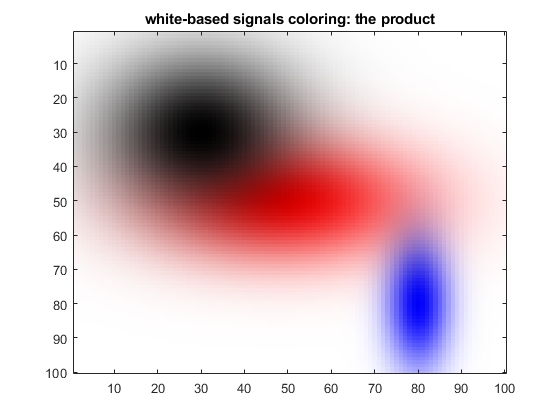
It can be seen that if to use for such representation the sum of RGB codes of signal components, the dynamic range of colour image is seriously reduced - red becomes light red, blue - light blue, black-dark grey - not much dark. It is defined by the necessity of the total scaling of the sum of individual RGB scales of components. To overcome such reduction of the final image RGB scale, instead of the sum can be used piecewise product of RGB coded components:
Q1=(q21.*q22.*q23);

figure;imagesc(Q1)
title('white-based signals colouring: the product')

In this case the final scaling is not necessary, and the dynamic range of the selected colours is much wider…